
Hey there, logistics champs! Let’s cut to the chase: the freight game is changing faster than a NASCAR pit stop. Gone are the days of “set it and forget it” shipping. Today, data-driven freight forwarding isn’t just a buzzword—it’s the backbone of modern supply chain success, especially when leveraging tools like digital freight forwarding solutions. Think about it: when traditional methods leave you guessing where your cargo is, analytics step in like a GPS for your supply chain.
The shift is real. Companies that once relied on gut calls are now crunching numbers to boost efficiency, slash costs, and wow customers. Why? Because in 2025, logistics analytics isn’t optional—it’s survival. Shippers are drowning in data but thirsty for insights. The solution? Track the right freight forwarding KPIs to turn chaos into clarity.
Here’s the kicker: visibility, efficiency, and ROI aren’t just corporate jargon. They’re the holy trinity of modern logistics. Whether you’re moving sneakers or server racks, shipping performance metrics are your roadmap to smoother operations and happier clients. Buckle up—we’re diving into the five metrics that’ll transform your logistics strategy.
Why Metrics Matter in Modern Freight Forwarding
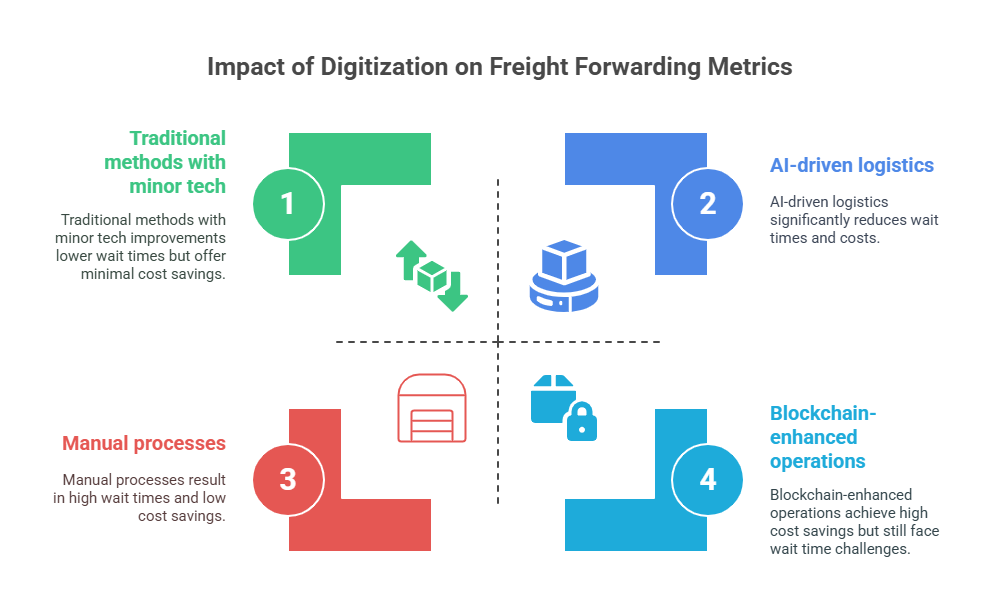
The freight game’s changing faster than a New York minute, and it’s all thanks to tech. From blockchain to AI-powered tracking tools, supply chains are getting a digital makeover. This shift isn’t just about keeping up with trends—it’s about survival. Companies that digitize see a 20% boost in operational efficiency, proving that ignoring data is like leaving money on the table.
Tracking the right KPIs turns guesswork into precision. Imagine cutting fuel costs by rerouting trucks in real-time or predicting delays before they happen. Logistics analytics let you spot inefficiencies you never knew existed—like that warehouse bottleneck slowing down 30% of your shipments.
But it’s not just about saving dollars. Happy customers? They’re the ones who get their shipments on time, every time. A 2024 study showed 78% of businesses prioritize on-time delivery when choosing a freight partner. Nail your shipping performance metrics, and you’re not just a vendor—you’re a trusted partner.
Here’s the kicker: 70% of supply chain leaders now prioritize digitization. They’re not just tracking metrics; they’re using them to stay ahead of the competition. Whether it’s optimizing routes or slashing wait times (the average dropped from 48 to 22 hours for early adopters), data-driven decisions are the secret sauce.
Why This Works:
- Operational Efficiency: Metrics like order accuracy and on-time delivery reduce costly errors.
- Cost Savings: Predictive analytics help avoid delays that drain budgets—40% of freight costs come from inefficiencies.
- Customer Trust: 92% of clients say transparency in tracking improves loyalty.
Metric #1: On-Time Delivery Rate
What It Is
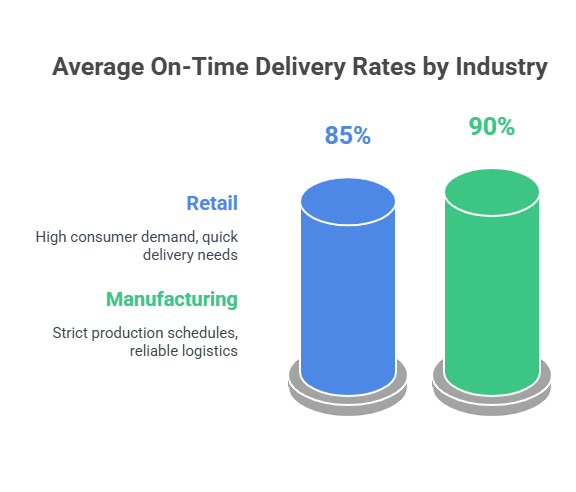
The on-time delivery rate measures the percentage of shipments that arrive on or before the promised delivery date. Think of it as your freight operation’s report card—hitting 95% means you’re facing reliability, while 70% might mean your supply chain needs tutoring.
Why It Matters
This metric isn’t just about avoiding angry customer calls. It’s the backbone of trust and repeat business. Companies with high on-time rates see 23% more customer loyalty than those who drop the ball. Plus, 84% of logistics firms now use analytics tools to track this KPI, proving it’s a must-have for staying competitive.
How to Track It
Use your transportation management system (TMS) to pull real-time data from GPS trackers and carrier updates. Tools like ShipBob or Penske Logistics automate this, so you’re not stuck manually crunching numbers.
Pro Tip
Benchmark carriers quarterly. If Carrier A hits 98% OTD and Carrier B lags at 82%, it’s time to renegotiate contracts or adjust routes.
Metric #2: Freight Cost per Unit Shipped
Break down costs to uncover hidden savings.
What It Is
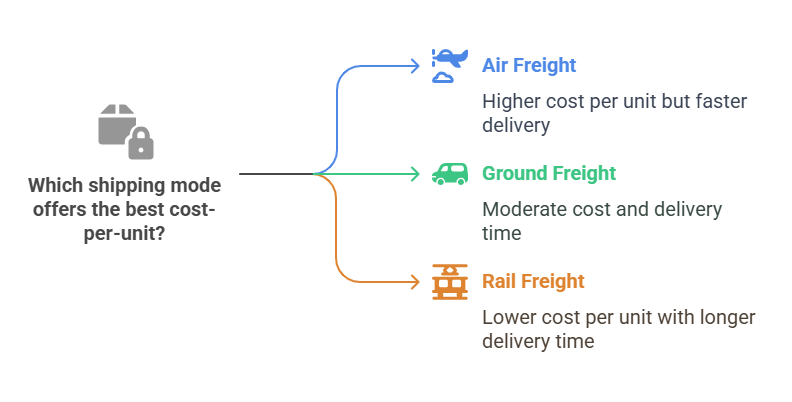
Freight cost per unit measures the total shipping expenses divided by the number of units shipped (or total weight/volume). Think of it as your “cost per widget” to move goods. For example, if you spend $5,000 to ship 1,000 units, your cost per unit is $5. This metric standardizes costs, making it easier to spot inefficiencies.
Why It Matters
In an industry where margins are tight, shaving even a few cents per unit adds up. Companies using this metric report 15–20% cost reductions by renegotiating carrier rates or switching modes. It’s not just about cutting costs—it’s about smarter spending.
How to Track It
Start by pulling cost data from your TMS (transportation management system), ERP, or carrier invoices. Use formulas like:
Total Freight Cost ÷ Units Shipped = Cost per Unit
Tools like logistics analytics platforms like Shipwell or Freightos automate this, flagging anomalies in real time.
Optimization Tips
- Mode Optimization: Rail might slash costs for bulk shipments vs. trucking.
- Carrier Negotiation: Use historical data to push for volume discounts.
- Route Planning: Avoid costly detours—tools like Route4Me reduce deadhead miles.
Real-World Win:
A Midwest furniture retailer used freight cost per unit to compare LTL (less-than-truckload) vs. FTL (full-truckload) options. By consolidating shipments into FTL for long hauls, they cut costs by $0.82 per unit, saving $125,000 annually.
Metric #3: Transit Time Variability
What It Is:
Transit time variability measures how consistently shipments arrive within expected timeframes. It’s calculated by comparing planned delivery schedules against actual arrival times. For example, if a shipment from Chicago to Los Angeles is scheduled for 5 days but sometimes takes 7, that inconsistency is your variability.
Why It Matters:
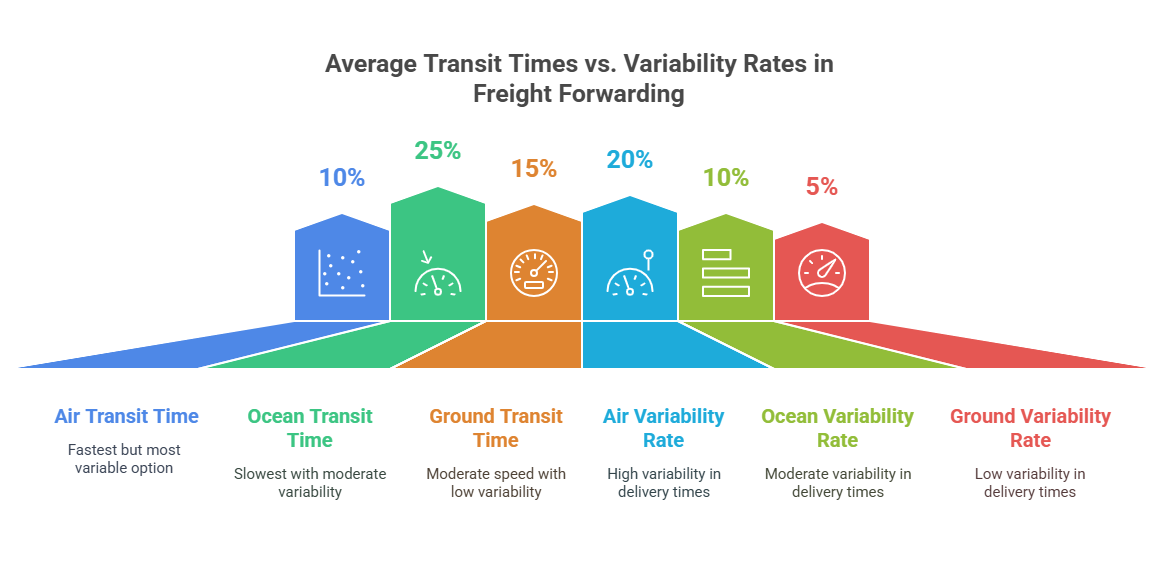
Inconsistent transit times throw a wrench in supply chain predictability. Even a 10% variation can disrupt just-in-time inventory systems, inflate safety stock needs, and strain client trust. A 2024 study found that 68% of logistics managers rank variability as a top threat to operational reliability, more than fuel costs or labor shortages.
How to Track It:
Use transportation management systems (TMS) to log planned vs. actual delivery times. Pair this with GPS data to identify bottlenecks. For instance, Windward’s maritime tracking tools show how port congestion in LA adds 2–3 days to ocean freight routes.
Action Steps:
- Analyze routes with the highest variability. A Dedola Global Logistics report found that rerouting shipments from overcrowded West Coast ports to Gulf Coast hubs cut variability by 22%.
- Leverage machine learning. Tools like those highlighted by LinkedIn’s logistics team predict delays using historical weather, traffic, and carrier performance data.
Pro Tip:
Share variability data with customers proactively. Retail giant Target reduced complaints by 15% after adding real-time transit updates to its supplier portal.
Case Study:
Toyota’s Just-in-Time Fix
After a 2023 study revealed that parts shortages due to transit variability cost $2.3M monthly, Toyota partnered with Flexport to map high-risk routes. Using real-time analytics, they cut variability by 30% and restored production schedules.
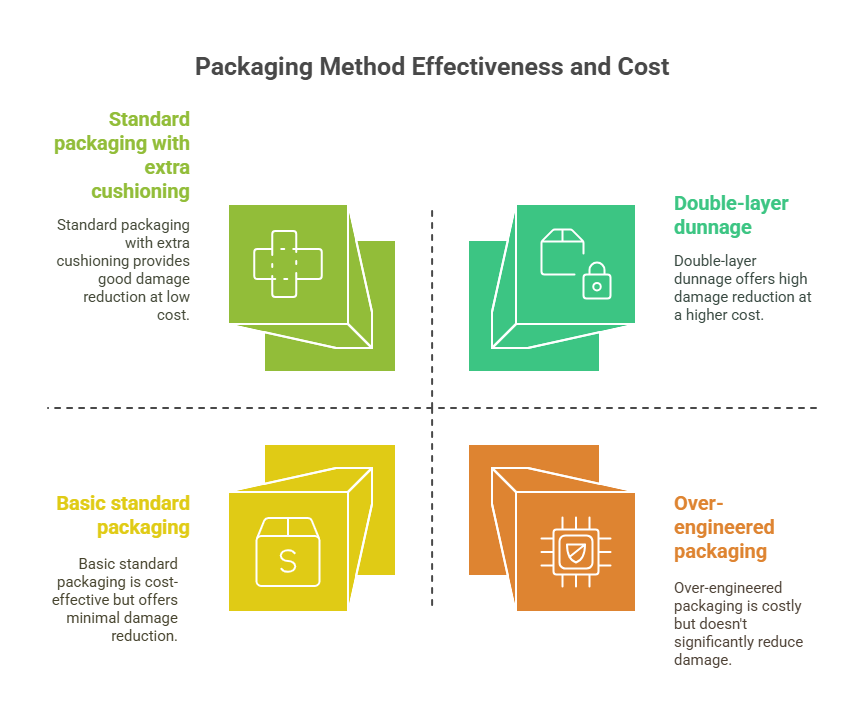
Metric #4: Damage or Loss Rate
What It Is:
The damage or loss rate measures the percentage of shipments that arrive damaged, lost, or otherwise compromised during transit. This metric is calculated by dividing the number of problematic shipments by the total shipments, multiplied by 100.
Why It Matters:
Every damaged or lost shipment chips away at your profit margins. For example, handling returns, repairs, and customer complaints adds hidden costs—up to 20-30% more per shipment in some cases. Beyond expenses, repeated issues hurt your reputation and strain customer trust. Insurance premiums also rise for businesses with frequent claims.
How to Track It:
- Damage claims: Monitor how often customers report issues.
- Carrier reports: Partner with carriers to share data on mishandled shipments.
- Customer feedback: Use surveys or reviews to catch unreported problems.
Optimization Tips:
- Upgrade packaging: Use impact-resistant materials and proper stacking techniques to reduce vibration damage.
- Vet carriers: Work with providers who have low damage rates and offer IoT tracking for real-time monitoring.
- Train teams: Educate staff on secure loading practices, like using dunnage to stabilize cargo.
Pro Tip:
Negotiate with carriers to include damage prevention clauses in contracts. For instance, some carriers offer discounts for shipments using certified packaging.
Metric #5: Order Accuracy Rate
What it is:
Order accuracy rate measures the percentage of shipments delivered exactly as ordered—no mix-ups, missing items, or substitutions. Think of it as the “golden standard” for logistics fulfillment. If a customer orders 100 units of Product A and gets 100 units of Product A, you’ve nailed it.
Why it matters:
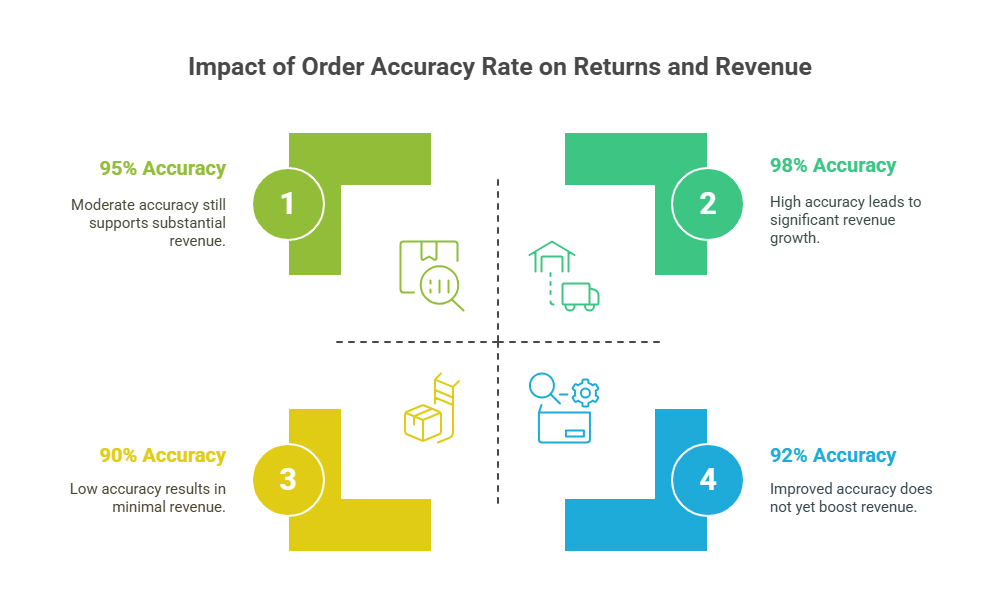
Even a small error can snowball. A wrong delivery frustrates customers, spikes return costs, and trashes your reputation. According to logistics experts, businesses with below 95% accuracy risk losing customers to competitors. On the flip side, hitting 98% accuracy (the industry sweet spot) boosts loyalty and reduces costly redos.
How to track it:
Use warehouse management systems (WMS) to log discrepancies during packing or shipping. Pair this with audit reports and customer feedback tools. For example, a Midwest e-commerce brand used barcode scanners and real-time WMS alerts to cut errors by 40% in six months.
Tips to Improve:
- Automate picking: Tools like RFID tags or AI-powered scanners reduce human error.
- Audit carriers: Partner with freight providers who prioritize accuracy (e.g., those with <1% damage/loss rates).
- Train teams: Regular workshops on order verification can turn accuracy into a company-wide priority.
Real-World Edge:
A 2025 study showed companies tracking order accuracy saw a 22% drop in returns and a 15% rise in repeat orders. It’s not just a metric—it’s a customer trust builder.
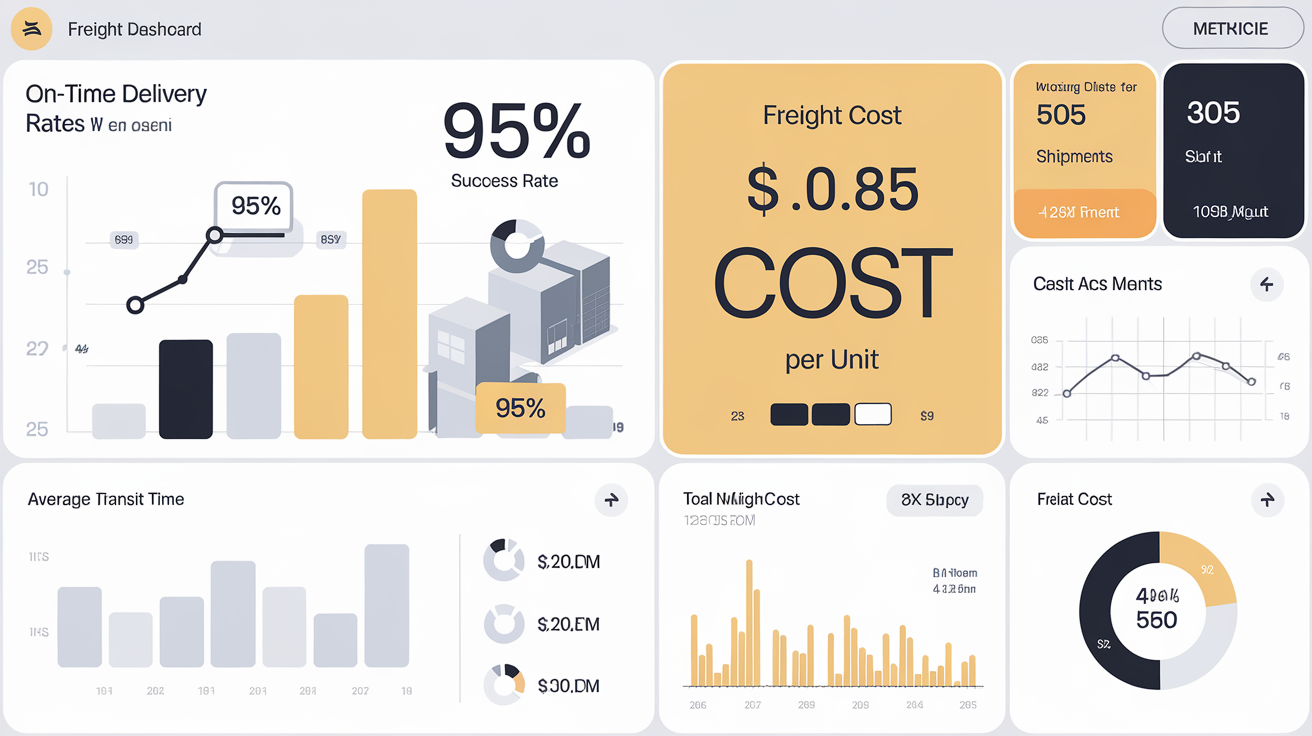
Bonus Tip: Use a Centralized Freight Analytics Dashboard
Tracking metrics is only half the battle—centralizing them turns data into actionable insights. Think of a freight analytics dashboard as your logistics command center, pulling together KPIs like on-time delivery rates, cost per unit, and damage rates into one easy-to-navigate hub. Here’s why it’s a game-changer:
Benefits of Centralized KPI Tracking
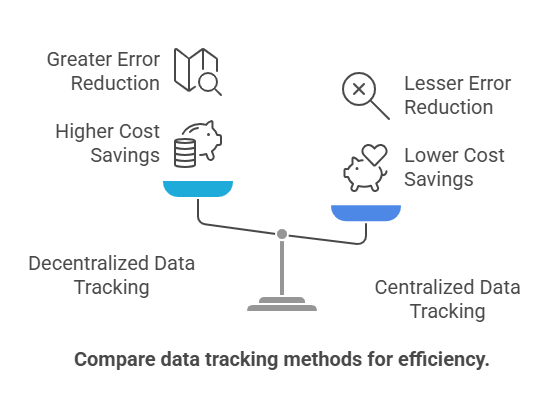
A single dashboard eliminates the headache of toggling between spreadsheets, emails, and carrier portals. It gives you a bird’s-eye view of operations, helping you spot trends, flag issues early, and make faster decisions. For example, companies using centralized analytics report 20% lower freight costs thanks to automated rate benchmarking and predictive ETAs. Plus, real-time updates ensure you’re never blindsided by delays or disruptions.
Top Tools to Consider
Not all dashboards are created equal. Tools like GoComet and Shipwell offer AI-driven analytics that optimize routes and reduce manual work. Logistics analytics tools like transport management systems (TMS) aggregate data from multiple sources to provide actionable insights. FourKites and project44 specialize in real-time tracking and predictive alerts, while Shipwell integrates with existing TMS for seamless data flow. These platforms don’t just save time—they boost accuracy, with some users cutting order errors by 30% through automated workflows.
Real-Time Alerts + AI Forecasting
Imagine getting a heads-up that a shipment will miss its ETA due to weather, before the delay happens. Modern dashboards use AI to analyze historical data and predict risks, letting you proactively reroute shipments or notify customers. Tools like GoComet even automate carrier negotiations, ensuring you always get competitive rates. It’s like having a crystal ball for your supply chain.
Pro Tip:
Pair your dashboard with IoT sensors to monitor fragile shipments in real time. If a package’s temperature spikes or gets jostled, you’ll know instantly, reducing damage claims and keeping customers happy.
Conclusion
The freight forwarding game has changed. Gone are the days of guesswork and gut calls—today, data-driven freight forwarding isn’t just a buzzword; it’s the backbone of staying competitive. By tracking the right metrics, businesses can cut costs, boost efficiency, and keep customers happy. Let’s recap the five must-watch metrics:
- On-Time Delivery Rate: Keep promises and protect your reputation.
- Freight Cost per Unit Shipped: Pinpoint waste and negotiate smarter.
- Transit Time Variability: Smooth out delays to build trust.
- Damage or Loss Rate: Safeguard profits with proactive fixes.
- Order Accuracy Rate: Avoid costly returns and keep clients loyal.
Ready to Transform Your Logistics Strategy?
At Rish Info Logistics, we’re not just keeping up with the trends—we’re setting them. Our ShipEasy platform is built to tackle the challenges modern freight forwarders face, from real-time visibility to automated documentation.
Don’t let outdated methods hold you back. Start tracking these metrics today to future-proof your operations—and get in touch with our team to see how ShipEasy can streamline your logistics from start to finish.
Ready to elevate your freight forwarding? Get in touch with Rish Info Logistics to schedule a demo of ShipEasy and discover how our tools can drive your success.
FAQs
While multiple metrics matter, on-time delivery rate is often prioritized because it directly impacts customer satisfaction and contract compliance. According to logistics benchmarks, companies with a 95 %+ on-time rate retain 30% more clients. Pair this with the freight cost per unit to balance efficiency and profitability.
Divide total shipping costs (fuel, labor, tariffs) by the number of units or weight shipped. For example:
Total Cost ÷ Units Shipped = Cost Per Unit
Tools like ShipEasy automate this calculation, integrating data from invoices and ERPs to ensure accuracy.
Top tools include:
- Transportation Management Systems (TMS) for real-time tracking.
- GPS & IoT Sensors for location and condition monitoring.
- Analytics Dashboards (e.g., ShipEasy, FourKites) for KPI visualization.
These tools reduce manual errors by 40% and boost decision-making speed.
Data identifies bottlenecks (e.g., weather, carrier delays) and enables proactive route adjustments. For example, predictive analytics can reduce transit variability by 25%. Real-time dashboards also alert teams to delays, speeding up resolution.
Absolutely. Cloud-based platforms like ShipEasy offer scalable, cost-effective solutions. Small businesses using analytics report 20% lower costs and 15% faster deliveries. Start with free tools like Google Analytics or low-cost TMS options.